Appearance
Portfolio Overview
Risk quantification is the backbone of AI governance in Modulos. It turns “what could go wrong” into a monetary decision signal you can prioritize, budget, delegate, and audit.
Governance loop
Four stations, one operating model.
Continuous risk governance
Quantification is a living process, not a one-time gate.
Identify
Make risks explicit and name them consistently
Quantify
Convert threats into monetary expected loss
Treat
Invest in mitigations with measurable impact
Monitor
Re-quantify as systems and data change
The dashed arc marks restart — every cycle re-enters Identify with what changed since the last pass.
Where in Modulos
Use these views to understand and manage risk exposure:
Organization → Risk Management → Risk Overviewfor portfolio rollups and top risk driversOrganization → Risk Management → Risk LimitsandProject Risk Limitsfor appetite and budgetsProject → Risksto add risks, select threats, and run quantification
For a full operating map and permissions model, see Operating Model.
Permissions
- Organization risk configuration is typically managed by the Organization Risk Manager role.
- Quantification runs are typically started by the Project Owner role.
- 1Where you areOrganization-level Risk Management gives you a portfolio view.
- 2Exposure summaryMonitor total exposure and how it compares to appetite.
- 3Top driversIdentify which projects contribute the most to portfolio exposure.
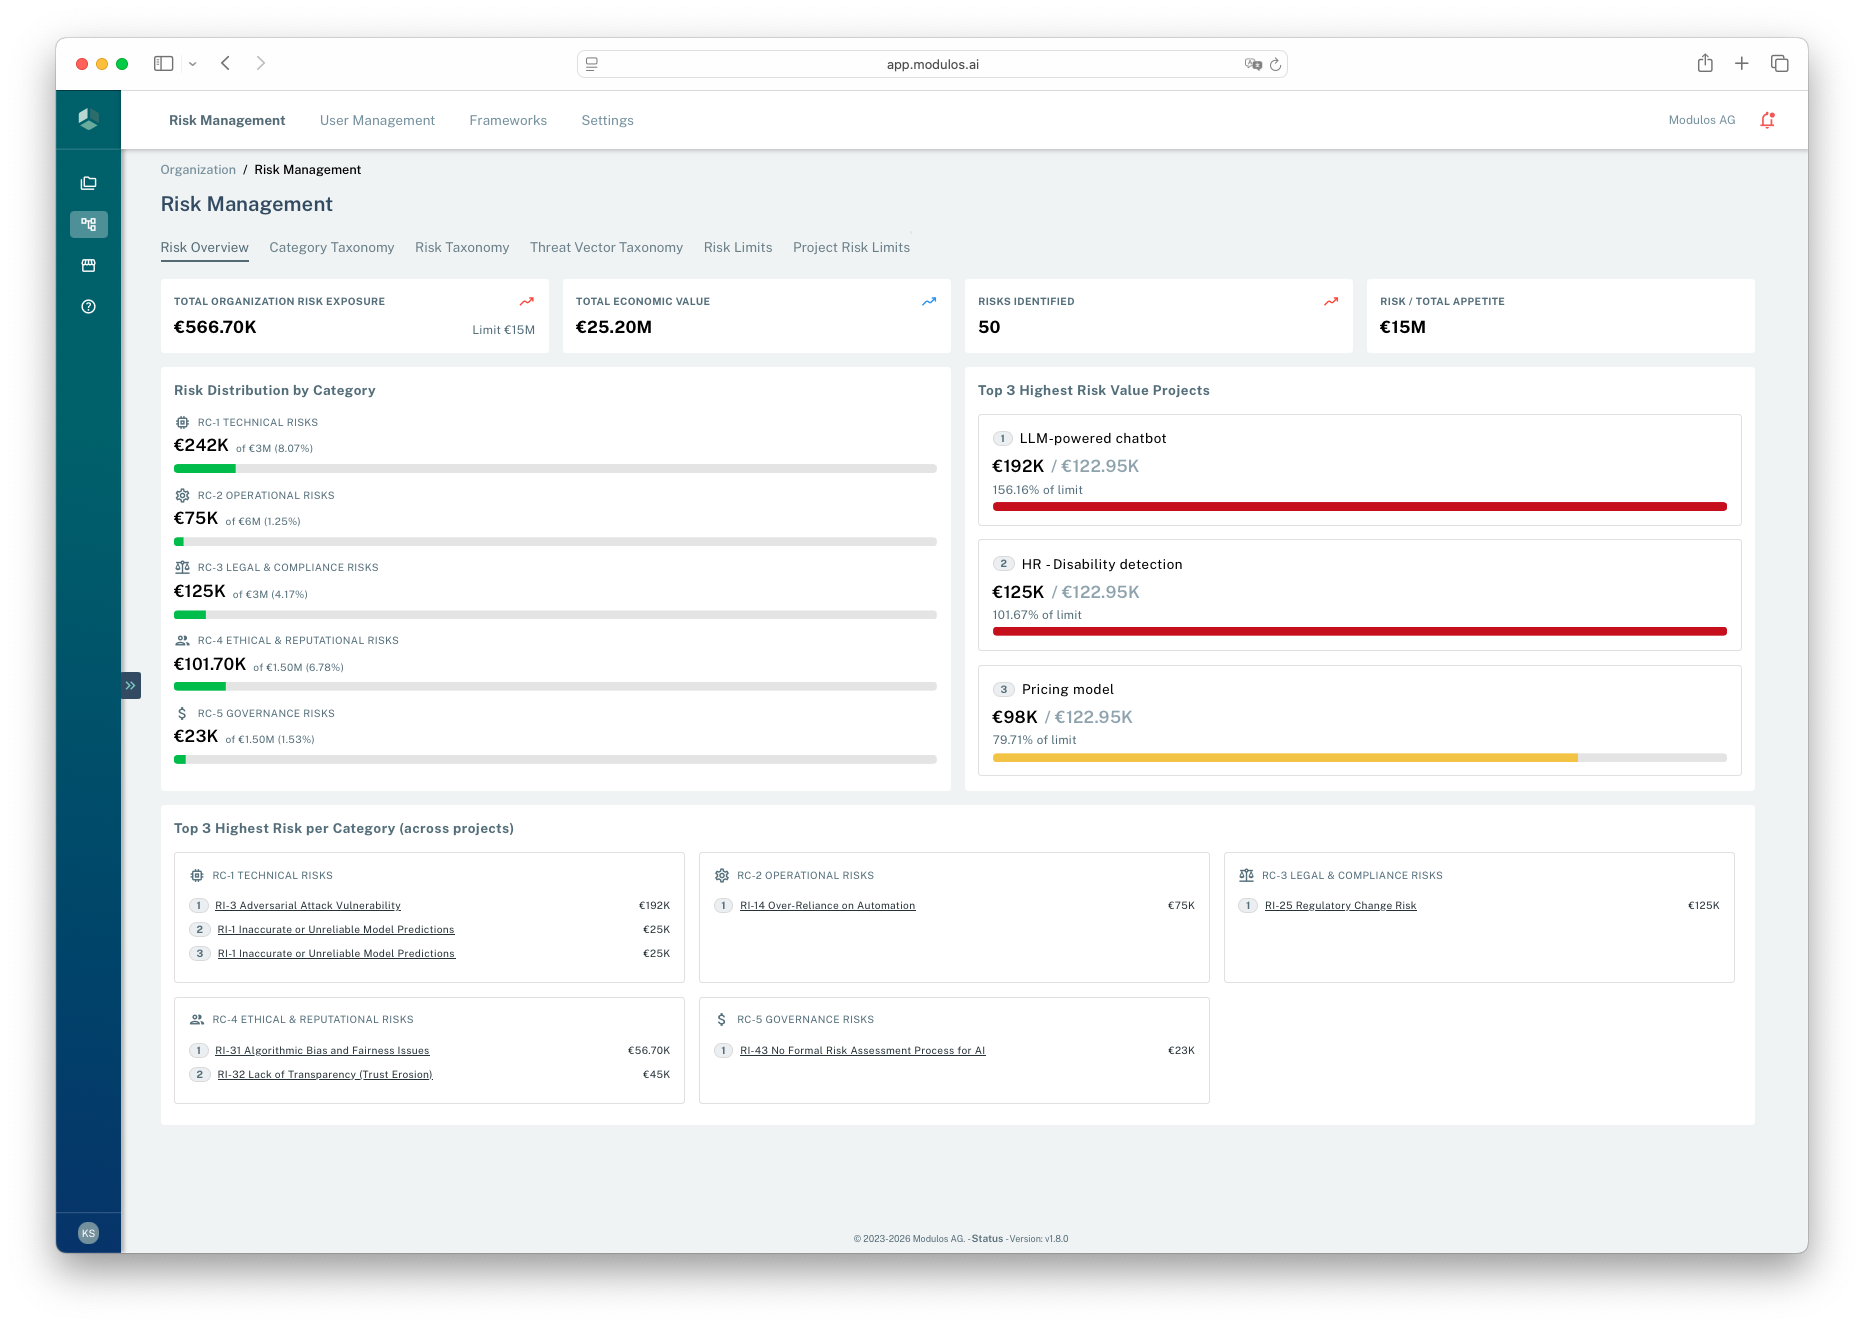
What's on the Risk Overview page
The Risk Overview tab in Organization → Risk Management is the org-level dashboard. It surfaces:
| Element | What it shows |
|---|---|
| Total Organization Risk Exposure (KPI) | Sum of quantified risk across all projects, with the organisation's Limit shown directly below for at-a-glance utilization. |
| Total Economic Value (KPI) | Total annual economic value of in-scope projects — the denominator against which exposure is judged. |
| Risks Identified (KPI) | Count of project risks currently in the portfolio. |
| Risk / Total Appetite (KPI) | Exposure as a percentage of the total monetary risk appetite. |
| Risk Distribution by Category | Per-category breakdown of exposure versus the category share of total appetite. Shows which categories are eating their budget. |
| Top 3 Highest Risk per Category (across projects) | The three highest-value risks in each category, each labelled with the project it lives in. The fastest path from "which category is hot?" to "which specific risk is driving it?". |
| Top 3 Highest Risk Value Projects | The three projects with the largest total quantified exposure, with drill-down to project Risks. |
These widgets read from quantified runs only — in-progress and errored runs are excluded. Re-quantify the underlying threats to move these numbers; appetite and category-share changes happen in Risk Limits.
Org-level history and timeseries
There is currently no organisation-level Quantification History table or Value Over Time chart. History and timeseries views exist at the threat-vector and risk level inside each project — see Reviewing past runs and trends.
What this is
Risk quantification is not risk avoidance. It makes risk explicit so leaders can decide what to accept, what to treat, and what to stop.
When risk stays qualitative, governance often becomes a veto without substance. When risk is monetary, it becomes a decision conversation: expected loss, risk appetite, and the cost of mitigation.
Quantification also enables speed:
- stage-gate decisions become explicit and repeatable
- teams can delegate decisions within defined risk thresholds
- “too risky” becomes a hypothesis you can challenge and refine
How it works
In Modulos, risks roll up from threats:
text
Expected loss = Σ (rate × damage)- Rate: how often the threat becomes an incident.
- Damage: the monetary loss per incident.
This decomposition is the point. It tells you where risk comes from and what mitigations should target.
Platform objects and rollups
- Organization taxonomy: shared categories, reusable risks, reusable threat vectors.
- Project risks: taxonomy risks selected into a project scope.
- Risk threats: project-specific instances of threat vectors.
- Quantification runs: method, inputs, outputs, status, and one monetary value per threat.
- Rollups and limits: threat → risk → project → category → organization.
Risk model
Three bands of structure, one rollup spine.
Organization
Threat vectors
Risks
Categories
Project
Project risks
Risk threats
Quantification
Quantification runs
€Expected loss
Rollup
The aggregation spine
Quantification happens at the threat level. Only quantified threats contribute to totals; everything else is a sum.
threat
→ risk
→ project
→ category
→ organization
Limits apply at every layer the spine touches: risk, project, category, organization. Threats are where the numbers come from; everything above is aggregation.
Risk appetite and limits
Quantification becomes actionable when it’s connected to appetite and delegation.
In the current platform model:
- organizations set a total monetary risk appetite
- categories define percentage shares of that appetite and must sum to 100%
- projects have risk limits that must sum to the organization appetite
- within each project category budget, individual risk limits must add up consistently
Risk budget cascade
One appetite, four layers, one conservation rule.
Organization
€15M
Categories
Technical€3M
Operational€6M
Legal & Compliance€3M
Ethical€1.5M
Governance€1.5M
Projects
LLM chatbot€2.4M
HR detection€2.0M
Pricing model€1.6M
Risks
Human–AI failure€900K
Insufficient testing€700K
Lack of transparency€800K
Conservation
Budgets must add up
The appetite is a single number. Every layer below must sum back to it; otherwise quantification is blocked.
Σ Category shares = 100%
Σ Project limits = appetite
Σ Risk limits = category
When sums fail, Modulos surfaces a warning and blocks quantification on the affected scope. The conservation rule is the same at every layer — only the entities change.
If limits do not add up consistently, Modulos surfaces warnings and blocks quantification until configuration is corrected.
Portfolio reality
Summing expected loss is a useful starting point. In real organizations, risks can be correlated through shared vendors, shared foundation models, and shared infrastructure. Use scenario analysis and dependency awareness for concentrated exposures.
How to use this
1
Set appetite
Define a total risk budget and category shares
2
Adopt the taxonomy
Start with the default library and add domain gaps
3
Quantify the top threats
Pick 1–3 threats per key risk and estimate expected loss
4
Treat and re-quantify
Invest in mitigations, then re-run as systems and data change